
These are three ways to obtain bullish option exposure without buying shares, but they are not substitutes with identical behavior. A Long Call is the simplest. A Call ZEBRA targets low net extrinsic value at entry. A Poor Man’s Covered Call sells a nearer call against a longer-dated one.
What Are You Choosing Between?
Compare initial debit, sensitivity to the stock, the price target and the need to manage a short option. The single call keeps uncapped upside without a short leg. The ZEBRA has two long ITM calls against one ATM call. The diagonal introduces separate expirations and changes the near-term rally payoff.
The Main Differences
Swipe the table to compare all columns →
| Compare | Call ZEBRA | Long Call | Poor Man’s Covered Call |
|---|---|---|---|
| Construction | Two ITM calls against one ATM call; entry time values offset here. | One purchased call; upside remains open. | Replace shares with a longer-dated ITM call. |
| Example entry | $2,000 net debit | $500 net debit | $1,100 net debit |
| Maximum profit | Unlimited | Unlimited | Depends on remaining option value and exit rule |
| Maximum loss | $2,000 | $500 | Requires the specified exit and assignment assumptions |
| Breakeven price | $100 | $105 | Changes with time value and volatility |
A Practical Example
The ZEBRA buys two $90 calls for $12.50 each and sells a $100 call for $5: its $2,000 debit equals the two long calls’ combined intrinsic value at a $100 stock price. The standalone $100 call costs $500. The PMCC costs $1,100 and still has a live long option at day 30. The chart uses the same day-30 stock prices but models that remaining option.
XYZ is at $100 when the option trades are entered. Premiums below are per share; each option contract covers 100 shares. Each column shows one complete position, not an equal-capital allocation. Prices are hypothetical and exclude commissions, taxes, dividends, financing costs and early-assignment cashflows.
| Position | Example legs |
|---|---|
| Call ZEBRA | Buy 2 $90 calls, 30 days, at $12.50 Sell 1 $100 call, 30 days, at $5 |
| Long Call | Buy 1 $100 call, 30 days, at $5 |
| Poor Man’s Covered Call | Buy 1 $90 call, 180 days, at $14 Sell 1 $105 call, 30 days, at $3 |
Comparing Value at the First Expiration
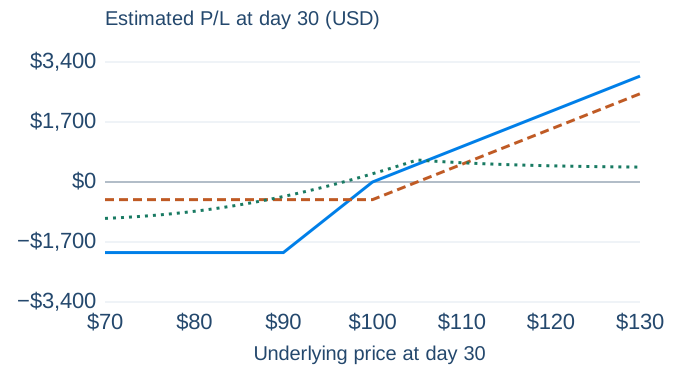
- Call ZEBRA
- Long Call
- Poor Man’s Covered Call
Swipe the table to compare all columns →
| XYZ price | Call ZEBRA | Long Call | Poor Man’s Covered Call |
|---|---|---|---|
| $80 | −$2,000 | −$500 | −$830.95 |
| $95 | −$1,000 | −$500 | −$113.67 |
| $100 | $0 | −$500 | $233.86 |
| $105 | $500 | $0 | $623.51 |
| $120 | $2,000 | $1,500 | $458.93 |
What to Watch For
Zero net extrinsic value does not guarantee stock-like performance at every future price. Nor does a smaller debit establish a better return: the positions have different deltas and management needs. The table compares one position of each, not equal-dollar or equal-delta portfolios.
Before expiration, time value and implied volatility can change a position’s market value. Short options also create exercise and assignment obligations. Review the full strategy guides for position management and settlement details.
Explore the Strategies
Try the examples:
- Call ZEBRA in the strategy builder
- Long Call in the strategy builder
- Poor Man’s Covered Call — diagonal calculator (enter the example’s legs and dates).