
The long Christmas Tree Spread is a butterfly variation using a 1:3:2 option ratio. The call version buys one lower-strike call, sells three middle-strike calls and buys two upper-strike calls. Its uneven strike spacing creates an asymmetric profit peak.
Names and related structures: Long call Christmas tree; 1-3-2 butterfly; long put Christmas tree.
Market Outlook
The trader targets the middle strike at expiration. The call version can express a modest bullish view when that strike is above the stock price; the put version can target a modest decline. A move far beyond the target can erase the gain.
Position Construction
Use one expiration. In the call example, the distance from the lower to middle strike is twice the distance from the middle to upper strike. This spacing balances the intrinsic payoff on the two tails. The six contracts occupy three distinct option legs.
| Action | Option | Expiration | Premium |
|---|---|---|---|
| Buy 1 | $90 call | Same expiry | $12 |
| Sell 3 | $100 call | Same expiry | $5 |
| Buy 2 | $105 call | Same expiry | $2.50 |
Example
Buy one $90 call for $12, sell three $100 calls for $5 each and buy two $105 calls for $2.50 each. The net debit is $200. At $100, the lower call pays $1,000, giving $800 profit. At $103, the options together pay $400, so profit falls to $200. At $105, their combined intrinsic value returns to zero and the $200 debit is lost.
All amounts use a 100-unit contract multiplier and exclude commissions and fees. These prices illustrate the arithmetic; they are not current market quotes.
Payoff Diagram
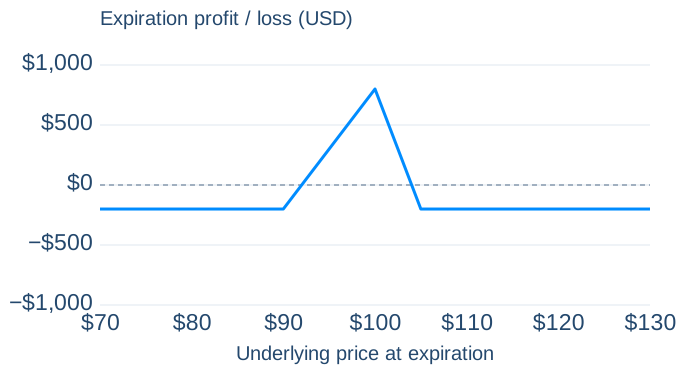
| Underlying price | Expiration P/L |
|---|---|
| $80 | −$200 |
| $90 | −$200 |
| $92 | $0 |
| $100 | $800 |
| $103 | $200 |
| $104 | $0 |
| $105 | −$200 |
| $115 | −$200 |
Maximum Profit
Maximum profit = (middle strike − lower strike − debit) × 100. The example earns $800 at $100. This requires a positive debit smaller than the lower-to-middle distance.
Maximum Loss
For the stated balanced spacing, maximum loss is the $200 debit, reached at $90 or below and $105 or above. Arbitrary strikes do not necessarily produce equal tail losses; calculate the payoff before using this rule.
Breakeven Point(s)
The lower breakeven is lower strike + debit = $92. Above the middle strike, the payoff falls by $2 per $1 stock move, so upper breakeven = middle strike + (lower wing width − debit) ÷ 2 = $104.
Put version and other names
A matching put example buys one $110 put, sells three $100 puts and buys two $95 puts. With a $2 debit, its breakevens are $96 and $108, maximum profit is $800 at $100, and maximum loss is $200. Some traders also use “Christmas tree” for a ladder; our existing ladder guides cover those different 1:1:1 structures. Always compare the legs, not just the name.
Risks and Position Management
Three short contracts at the middle strike make the narrow side of the peak sensitive to small price changes. Six contracts also mean more commissions and potentially more slippage. Assignment of some, but not all, short contracts can leave shares after expiration.
Before expiration, option prices also reflect time remaining and volatility. The expiration diagram does not show every interim gain or loss. Trading costs reduce profits and increase losses. Review the contract’s exercise and settlement rules before trading.
Explore the Position
Open this example in the Advanced Strategy Builder. The example legs, quantities and premiums are filled in so you can change them and compare expiration outcomes.
Related Strategies
Compare This Strategy
Optional further reading to help you compare the tradeoffs.
- Butterfly vs Christmas Tree Spread — Compare the width of the profitable region as well as the maximum gain.
Structure reference: Strategy reference. Example premiums and calculations are illustrative. Editorial standards.