
The Batman described here combines a Call Ratio Spread with a Put Ratio Spread. Each side buys one option and sells two farther out-of-the-money options. The two short strikes form separate profit peaks, but the extra short contracts leave the outer losses unprotected.
Names and related structures: Double Ratio Spread; paired call and Put Ratio Spreads.
Market Outlook
The position seeks an expiration price near either short strike, following a moderate move from the starting price. A much larger move can be damaging. Its central result depends on the entry premium: two peaks do not imply that every price between them is profitable.
Position Construction
Buy one $95 put and sell two $90 puts. Buy one $105 call and sell two $110 calls. All six contracts share one expiration; they form four distinct option legs.
| Action | Option | Expiration | Premium |
|---|---|---|---|
| Buy 1 | $95 put | Same expiry | $3 |
| Sell 2 | $90 put | Same expiry | $1 |
| Buy 1 | $105 call | Same expiry | $3 |
| Sell 2 | $110 call | Same expiry | $1 |
Example
With XYZ at $100, the long options cost $6 and the four short contracts collect $4 per share-equivalent. The debit is $2, or $200. At $90, the $95 put pays $500 and the remaining options expire worthless, leaving $300 profit. The same profit occurs at $110. Between $95 and $105 the position loses its $200 debit. At $80 or $120, it loses $700.
All amounts use a 100-unit contract multiplier and exclude commissions and fees. These prices illustrate the arithmetic; they are not current market quotes.
Payoff Diagram
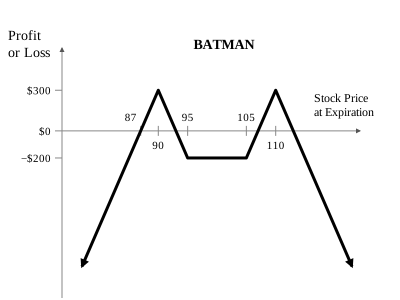
| Underlying price | Expiration P/L |
|---|---|
| $0 | −$8,700 |
| $80 | −$700 |
| $87 | $0 |
| $90 | $300 |
| $93 | $0 |
| $100 | −$200 |
| $107 | $0 |
| $110 | $300 |
| $113 | $0 |
| $120 | −$700 |
Maximum Profit
Maximum profit in this equal-width example is ($5 − $2) × 100 = $300, at either $90 or $110. Unequal widths produce different peak heights; evaluate both short strikes.
Maximum Loss
Upside loss is unlimited because two short calls exceed the one long call. With a stock price floor of zero, the downside loss in this example is $8,700. Do not describe the position as defined-risk merely because it contains purchased options.
Breakeven Point(s)
There are four breakevens: $87, $93, $107 and $113. The profitable intervals are $87–$93 and $107–$113. Solve the payoff of each section separately when strikes, ratios or debit change.
Check the version being discussed
This guide uses the double-ratio construction. Adding outer long options creates a different, bounded structure. Two butterflies or two Iron Butterflies also produce two peaks, but their risks and premiums are not interchangeable with this example.
Risks and Position Management
Uncovered short contracts can require substantial margin. The position can lose money both in the middle and beyond its profit peaks. Assignment, liquidity and financing matter before expiration. The nickname is used for other structures too; check the exact legs rather than relying on the name.
Before expiration, option prices also reflect time remaining and volatility. The expiration diagram does not show every interim gain or loss. Trading costs reduce profits and increase losses. Review the contract’s exercise and settlement rules before trading.
Explore the Position
Related Strategies
Structure reference: Strategy reference. Example premiums and calculations are illustrative. Editorial standards.
Advanced Strategy Variations
Build on the core strategies with these less common structures. Match the option legs and expirations when comparing names.