
A stock-repair position combines an existing stock holding with a Call Ratio Spread. A Covered Call adds just one short call to that holding. The comparison is whether to reshape a possible recovery, not whether an option trade can erase a loss already incurred.
What Are You Choosing Between?
Separate the original purchase price from today’s stock price. The repair structure can accelerate recovery over a limited interval, then cap further gains. A Covered Call collects income but may lock in a loss if its strike is below the remaining breakeven. Compare both with simply keeping or selling the shares.
The Main Differences
Swipe the table to compare all columns →
| Compare | Stock Repair | Covered Call |
|---|---|---|
| Construction | Keep the losing shares, buy one call and sell two higher calls. | Keep the same losing shares and sell one higher call. |
| Example entry | $12,000 net debit | $11,750 net debit |
| Maximum profit | $0 | No profit; best result −$750 |
| Maximum loss | $12,000 | $11,750 |
| Breakeven price | At or above $110 | None in this example |
Entry amounts include the stated stock purchase cost or short-sale proceeds. A net credit is not the broker’s required collateral, and historical stock cost is not new cash invested today.
A Practical Example
Assume 100 shares were bought at $120 and now trade at $100. For this example, the $100 call costs $5 and the $110 call costs $2.50. Buying one and selling two costs no net option premium. The repair position breaks even on the original $12,000 basis at $110, then remains capped. The Covered Call sells only one $110 call and still has a $750 total loss at $110 or above.
XYZ is at $100 when the option trades are entered. Premiums below are per share; each option contract covers 100 shares. Each column shows one complete position, not an equal-capital allocation. Prices are hypothetical and exclude commissions, taxes, dividends, financing costs and early-assignment cashflows.
| Position | Example legs |
|---|---|
| Stock Repair | Own 100 shares at $120 Buy 1 $100 call, 30 days, at $5 Sell 2 $110 calls, 30 days, at $2.50 |
| Covered Call | Own 100 shares at $120 Sell 1 $110 call, 30 days, at $2.50 |
Comparing the Expiration Payoffs
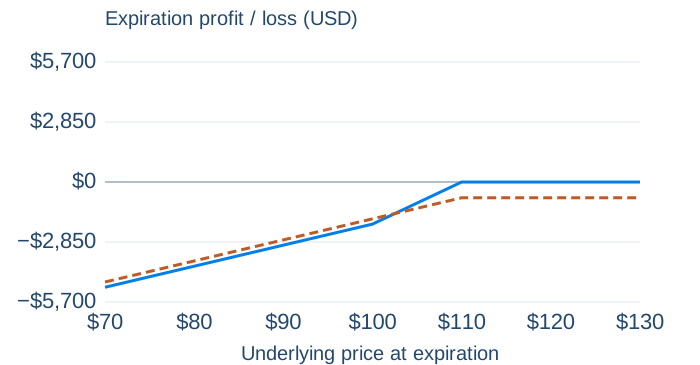
- Stock Repair
- Covered Call
Swipe the table to compare all columns →
| XYZ price | Stock Repair | Covered Call |
|---|---|---|
| $80 | −$4,000 | −$3,750 |
| $100 | −$2,000 | −$1,750 |
| $105 | −$1,000 | −$1,250 |
| $110 | $0 | −$750 |
| $120 | $0 | −$750 |
What to Watch For
The recovery does not come free: gains above $110 are surrendered, and further stock losses remain. A new premium credit must not be presented as a profit while ignoring the old stock loss. The table and chart both include the original $120 share cost.
Before expiration, time value and implied volatility can change a position’s market value. Short options also create exercise and assignment obligations. Review the full strategy guides for position management and settlement details.
Explore the Strategies
Try the examples: